


- Main Sector(s): Office & Retail
- Country(s) with Assets: Singapore, China, Hong Kong, Japan & South Korea
- No. of Properties (exclude development/associate/fund): 18
Key Indicators


Shopper Traffic & Tenant Sales


Related Parties Shareholding

- REIT Sponsor's Shareholding: Above median by 20% or more
- REIT Manager's Shareholding: Above median by 20% or more
- Directors of REIT Manager's Shareholding: Below median by 20% or more
Lease Profile
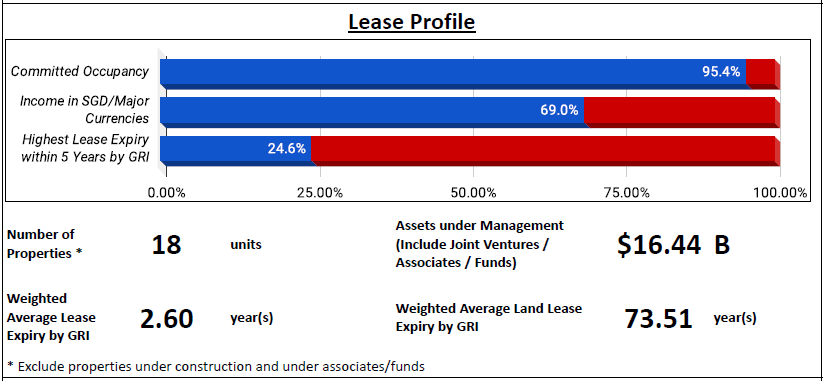
- Occupancy: ± 5% from median
- Income in SGD/Major Currencies: Below median by 20% or more
- WALE: Below Below median by 20% or more
- Highest Lease Expiry within 5 Years: ± 10% from median; Falls in FY24/25
- Weighted Average Land Lease Expiry: ± 10% from median
Debt Profile

- Gearing Ratio: ± 10% from median
- Gearing including Perps: ± 10% from median
- Cost of Debt: Below median by 20% or more
- Fixed Rate Debt %: ± 10% from median
- Unsecured Debt %: ± 10% from median
- WADM: ± 10% from median
- Highest Debt Maturity within 5 Years: Below median by 20% or more; Falls in FY24/25
- Interest Coverage Ratio: ± 10% from median
Diversification Profile

- Top Geographical Contribution: ± 10% from median
- Top Property Contribution: Above median by 20% or more
- Top 5 Properties' Contribution: Above median by 20% or more
- Top Tenant Contribution: Below median by 20% or more
- Top 10 Tenants' Contribution: Below median by 20% or more
Key Financial Metrics

- Property Yield: Below median by 10% or more
- Management Fees over Operating Distributable Income: Below median by 20% or more; $8.77 distribution for every dollar paid
- Operating Distributable Income on Capital: ± 10% from median
- Operating Distributable Income Margin: Above median by 10% or more
- Operating Distribution Proportion: Above median by 5% or more
DPU Breakdown

- TTM DPU Breakdown
- 95.6% from Operation
- 4.4% from Management Fees Paid in Units
- TTM DPU = 99.8% of Distributable Income
Trends


- Uptrend: DPU from Operation, NAV per Unit
- Flat: Interest Coverage Ratio
- Slight Downtrend: Occupancy, Operating Distributable Income Margin
- Downtrend: Property Yield, Operating Distributable Income on Capital
Relative Valuation


- P/NAV: Average for 1y; Below -1SD for 3y & 5y
- Dividend Yield: Average for 1y; Above +1SD for 3y & 5y
Author's Opinion
| Favorable | Less Favorable |
|---|---|
| Diversified Sector | Low Directors of REIT Manager's Shareholding |
| High REIT Sponsor's Shareholding | Low Income in SGD/Major Currencies |
| High REIT Manager's Shareholding | Short WALE |
| Low Cost of Debt | High Top Property & Top 5 Properties' Contributions |
| Well Spread Debt Maturity | Low Property Yield |
| Low Top Tenant & Top 10 Tenants' Contributions | Property Yield Downtrend |
| Competitive Management Fees | Operating Distributable Income on Capital Downtrend |
| High Operating Distributable Income Margin | |
| High Operating Distribution Proportion | |
| DPU from Operation Uptrend | |
| NAV per Unit Uptrend |
The gross revenue and NPI have slightly declined as compared to the previous quarter, however, DPU has declined by 7% from 2.42 cents to the current 2.25 cents. To identify the reasons for the decline, first, match the items from the profit and loss statement and distribution statement, and check out the cash flows statement for distribution received from the joint venture.

Next, offset and get the adjusted figures for the profit and loss statement as well as the distribution statement.

Now, we can see the breakdown for the decline of S$ 9.448 mils in distributable income, below are some highlights:
- NPI declined by S$ 2.011 mils
- Borrowing Cost increased by S$ 0.707 mil
- Manager's Fee declined by S$ 0.601 mil
- Foreign Exchange Loss increased by S$ 0.79 mil
- Tax Expenses declined by S$ 0.553 mil
- Realized Gain from Financial Derivatives declined by S$ 9.258 mils
While the rental reversion of MBC and VivoCity is decent, the rental reversion of Festival Walk remains poor at -12.7% for FY22/23. However, the magnitude has reduced from -27% and -21% in FY21/22 and FY20/21 respectively. On a positive note, shopper traffic and tenant sales of Festival Walk have improved since the border with mainland China was reopened and the lifting of restrictions.
For more information, check out:
SREITs Dashboard - Detailed information on individual Singapore REIT
SREITs Data - Overview and details of Singapore REIT
REIT Review - List of previous REIT review posts
Singapore REITs Post Telegram Channel - Join to receive posts for Singapore REITs
REIT-TIREMENT Patreon - Support my work and get exclusive content
REIT-TIREMENT Facebook Page - Support by liking my Facebook Page
REIT Investing Community - Facebook Group where members share and discuss REIT topic
*Disclaimer: The information presented on this blog is for educational and informational purposes only. The materials, including research and opinions, are based solely on my own findings and should not be considered as professional financial advice or a definitive statement of fact. I cannot guarantee the accuracy, completeness, or reliability of the information provided. I shall not be held liable for any errors, omissions, or losses that may occur as a result of using the information presented on this blog. It should be noted that the information presented on this blog does not constitute a buy, sell, or hold recommendation for any security. It is crucial to conduct your own thorough research and due diligence before making any investment decisions.

No comments:
Post a Comment