


- Main Sector(s): Office & Logistics
- Country(s) with Assets: India
- No. of Properties (exclude development/associate/fund): 10
Key Indicators


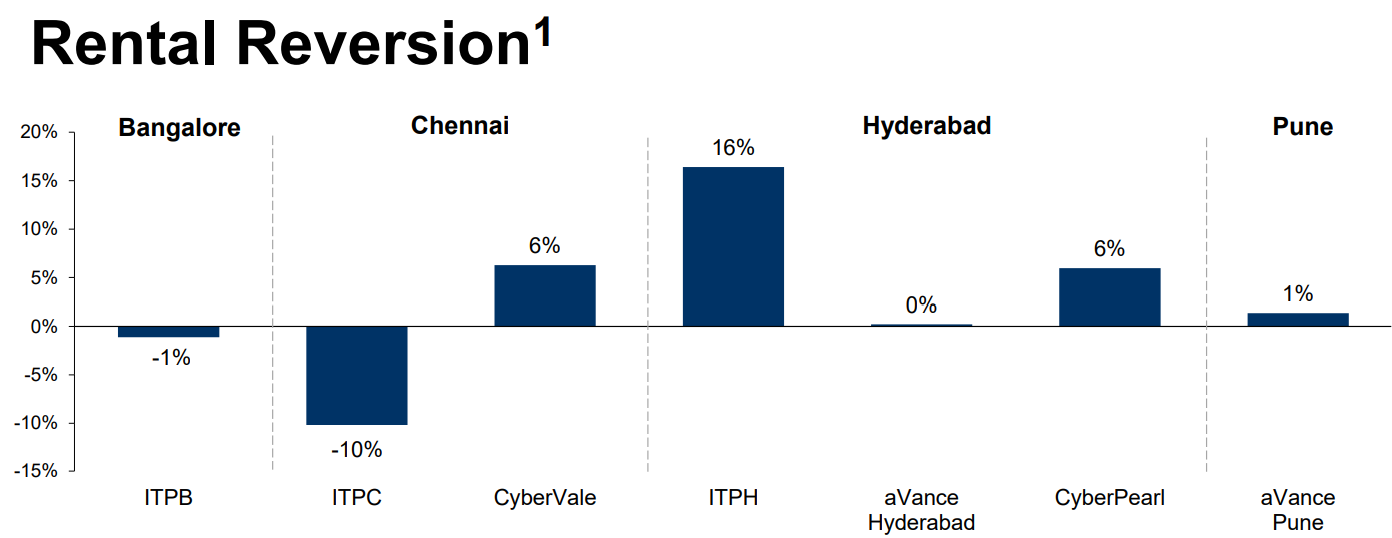
Rental Reversion
Acquisition


Pipeline (3rd Party Forward Purchase)

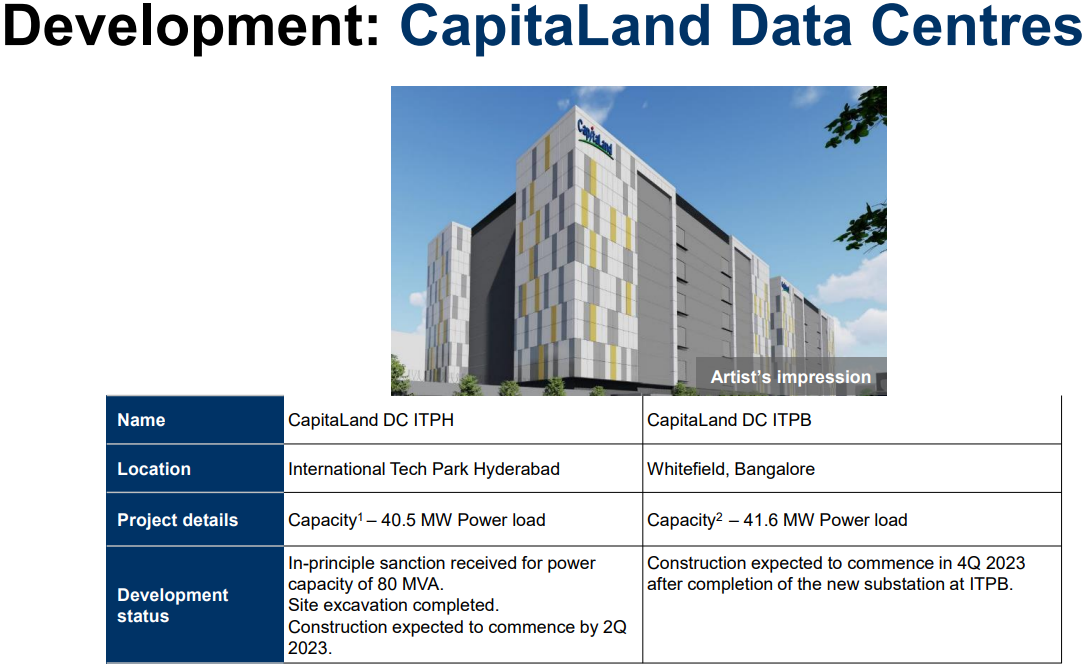
Development


Related Parties Shareholding

- REIT Sponsor's Shareholding: Below median by 10% or more
- REIT Manager's Shareholding: Above median by 20% or more
- Directors of REIT Manager's Shareholding: Above median by 20% or more
Lease Profile

- Occupancy: ± 5% from median
- All income received in India Rupee
- WALE: ± 10% from median
- Highest Lease Expiry within 5 Years: Above median by 20% or more; Falls in 2027 and beyond, without breakdown
- Weighted Average Land Lease Expiry: Above median by 20% or more
Debt Profile
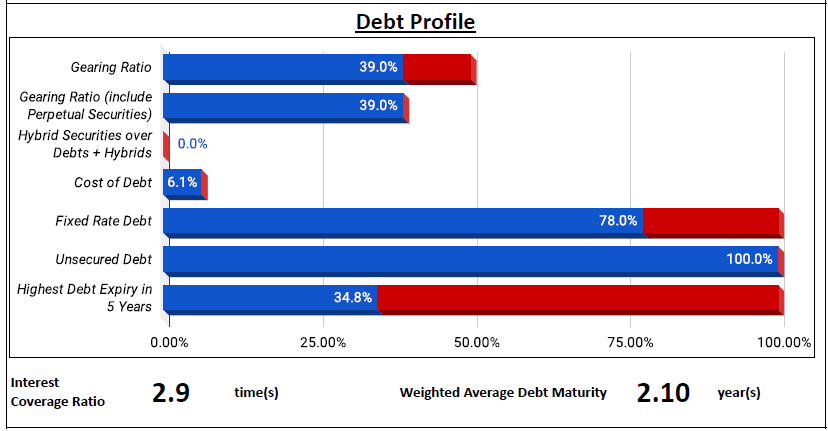
- Gearing Ratio: ± 10% from median
- Cost of Debt: Above median by 20% or more
- Fixed Rate Debt %: ± 10% from median
- Unsecured Debt %: 100%
- WADM: Below median by 20% or more
- Highest Debt Maturity within 5 Years: ± 10% from median; Falls in this year
- Interest Coverage Ratio: Below median by 20% or more
Diversification Profile

- Top Geographical Contribution: Below median by 20% or more
- Top Property Contribution: Above median by 20% or more
- Top 5 Properties' Contribution: Above median by 20% or more
- Top Tenant Contribution: Above median by 10% or more
- Top 10 Tenants' Contribution: Above median by 20% or more
Key Financial Metrics

- Property Yield: Above median by 20% or more
- Management Fees over Operating Distributable Income: Above median by 10% or more; $5.26 distribution for every dollar paid
- Operating Distributable Income on Capital: Above median by 10% or more
- Operating Distributable Income Margin: ± 10% from median
- Operating Distributable Proportion: ± 10% from median
DPU Breakdown

- TTM DPU Breakdown
- 90.6% from Operation
- 9.4% from Management Fees Paid in Units
- TTM DPU = 90% of Distributable Income
Trends


- Uptrend: NAV per Unit, Operating Distributable Income Margin
- Slight Uptrend: DPU from Operation
- Downtrend: Occupancy, Interest Coverage Ratio, Property Yield, Operating Distributable Income on Capital
Relative Valuation


- P/NAV: Average for 1y; Below -1SD for 3y & 5y
- Dividend Yield: Above +1SD for 1y, 3y & 5y
Author's Opinion
| Favorable | Less Favorable |
|---|---|
| High REIT Manager's Shareholding | All income received in India Rupee |
| High Directors of REIT Manager's Shareholding | High Cost of Debt |
| Long Weighted Average Land Lease Expiry | Short WADM |
| 100% Unsecured Debt | Low Interest Coverage Ratio |
| Low Top Geographical Contribution | High Top Property & Top 5 Properties' Contributions |
| High Property Yield | High Top Tenant & Top 10 Tenants' Contributions |
| High Operating Distributable Income on Capital | Non-Competitive Management Fees |
| NAV per Unit Uptrend | Occupancy Downtrend |
| Operating Distributable Income Margin Uptrend | Interest Coverage Ratio Downtrend |
| Property Yield Downtrend | |
| Operating Distributable Income on Capital Downtrend |
In terms of SGD, the gross revenue and NPI are similar to the previous quarter. However, there is around 1/3 of the debt needs to be refinanced this year, which could potentially drive up the cost of debt. On a positive note, the recent pause in monetary policy tightening by the MAS should be favorable to CLINT, as it is likely to lead to a stabilization of the S$/INR FX rate.
For more information, check out:
SREITs Dashboard - Detailed information on individual Singapore REIT
SREITs Data - Overview and details of Singapore REIT
REIT Review - List of previous REIT review posts
Singapore REITs Post Telegram Channel - Join to receive posts for Singapore REITs
REIT-TIREMENT Patreon - Support my work and get exclusive content
REIT-TIREMENT Facebook Page - Support by liking my Facebook Page
REIT Investing Community - Facebook Group where members share and discuss REIT topic
*Disclaimer: The information presented on this blog is for educational and informational purposes only. The materials, including research and opinions, are based solely on my own findings and should not be considered as professional financial advice or a definitive statement of fact. I cannot guarantee the accuracy, completeness, or reliability of the information provided. I shall not be held liable for any errors, omissions, or losses that may occur as a result of using the information presented on this blog. It should be noted that the information presented on this blog does not constitute a buy, sell, or hold recommendation for any security. It is crucial to conduct your own thorough research and due diligence before making any investment decisions.

No comments:
Post a Comment