


- Main Sector(s): Industrial
- Country(s) with Assets: Singapore, United States & Canada
- No. of Properties (exclude development/associate/fund): 141
Key Indicators


- Distributable Income Breakdown:
- 95.4% from Operation
- 0.8% from Release of Retention/Capital
- 1.7% from Fees Paid/Payable in Units
- 2.1% from Proceeds from Divestment
- Distribution = 100% of Distributable Income
- Distribution to Perpetual Securities Holder = 2.6% of Distributable Income
Related Parties Shareholding

- REIT sponsor's shareholding: ± 10% from median
- REIT manager's shareholding: ± 10% from median
- Directors of REIT manager's shareholding: Above median for more than 20%
Lease Profile

- Occupancy: ± 5% from median
- WALE: ± 10% from median
- Highest lease expiry within 5 years: Below median for more than 20%. Falls in FY25/26
- Weighted average land lease expiry: Below median for more than 20%
Debt Profile

- Gearing ratio: ± 10% from median
- Gearing ratio including perps: ± 10% from median
- Cost of debt: ± 10% from median
- Fixed rate debt %: ± 10% from median
- Unsecured debt %: 100%
- WADM: ± 10% from median
- Highest debt maturity within 5 years: ± 10% from median; Falls in FY26/27
- Interest coverage ratio: Above median for more than 20%
Diversification Profile

- Top geographical contribution: ± 10% from median
- Top property contribution: Below median for more than 20%
- Top 5 properties' contribution: Below median for more than 20%
- Top tenant contribution: Below median for more than 20%
- Top 10 tenants' contribution: Below median for more than 20%
Key Financial Metrics

- Property yield: Above median for more than 20%
- Management fees over distribution: ± 10% from median; $6.29 distribution for every dollar paid
- Distribution on capital: Above median for more than 20%
- Distribution margin: ± 10% from median
Trends

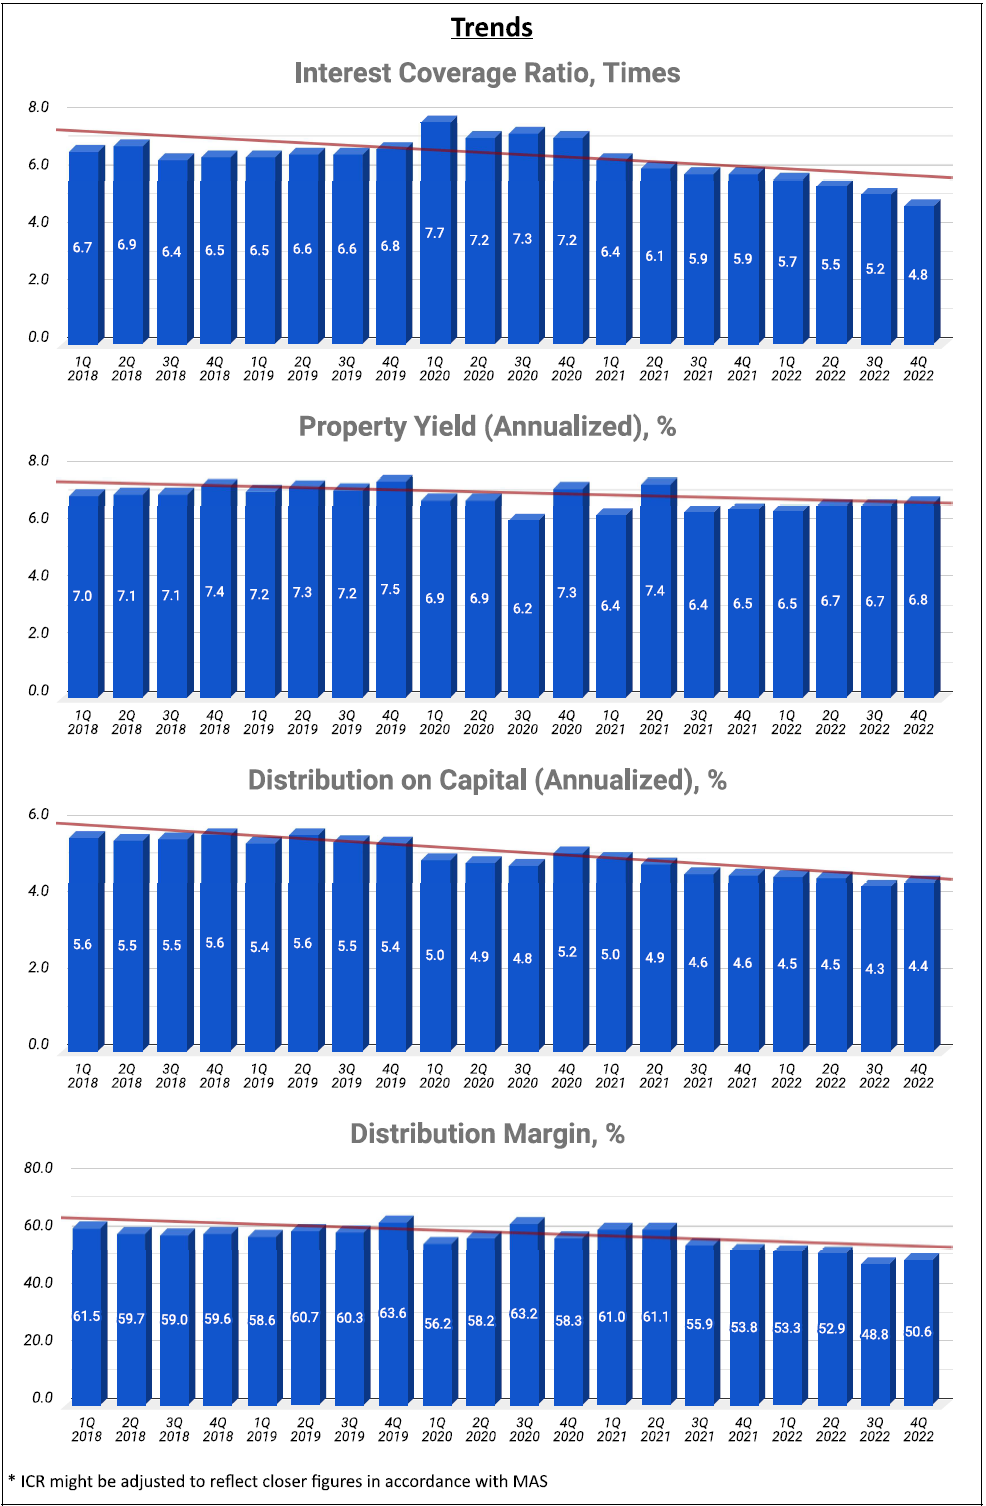
- Uptrend: DPU, NAV per Unit, Occupancy
- Slight Downtrend: Property Yield
- Downtrend: Interest Coverage Ratio, Distribution on Capital, Distribution Margin
Relative Valuation

- P/NAV: Below average for 1y; Below -1SD for 3y & 5y
- Dividend Yield: Average for 1y; Above +1SD for 3y; Above average for 5y
Author's Opinion
| Favorable | Less Favorable |
|---|---|
| High Directors of REIT Manager's Shareholding | Short Weighted Average Land Leases Expiry |
| Well Spread Lease Expiry | Interest Coverage Ratio Downtrend |
| 100% Unsecured Debt | Distribution on Capital Downtrend |
| High Interest Coverage Ratio | Distribution Margin Downtrend |
| Low Top Property & Top 5 Properties Contributions | |
| Low Top Tenant & Top 10 Tenants Contributions | |
| High Property Yield | |
| High Distribution on Capital | |
| DPU Uptrend | |
| NAV per Unit Uptrend | |
| Occupancy Uptrend |
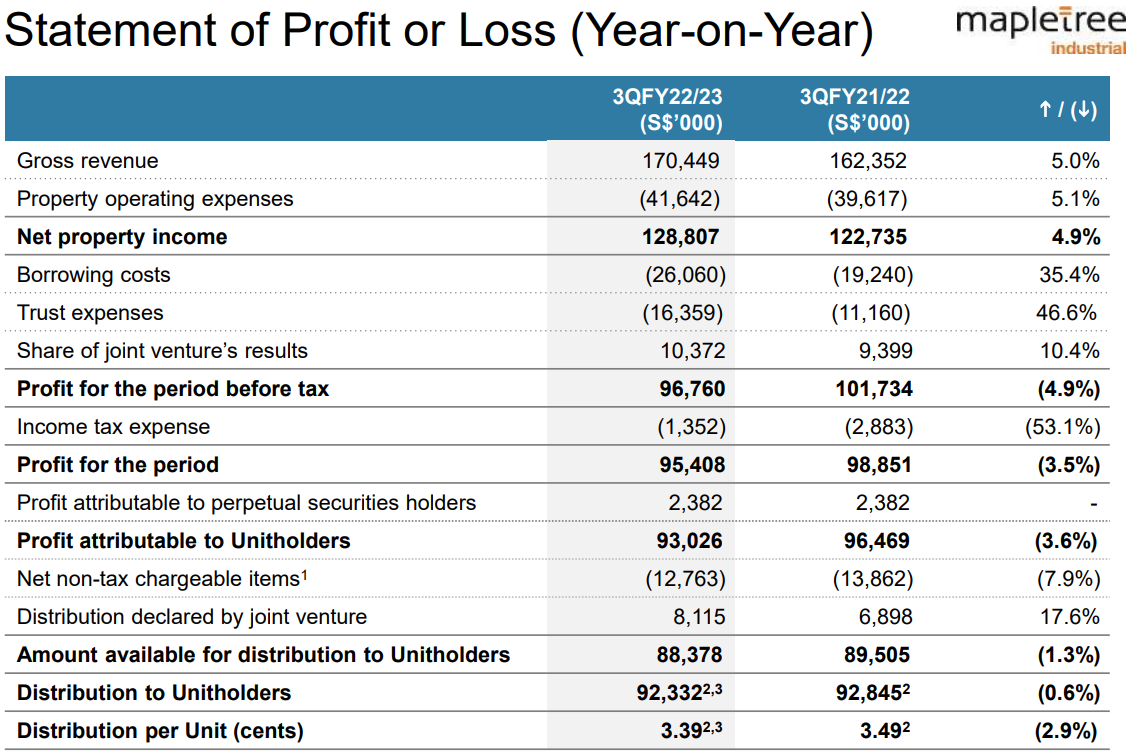
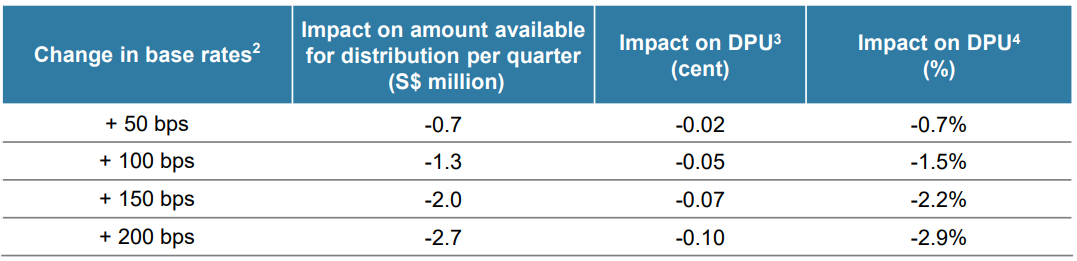
Fundamental remains resilient although the performance has declined slightly as compared to the previous quarter, with lower gross revenue/NPI coupled with higher borrowing costs. The increasing borrowing costs continue to affect the DPU and there is also an 11.8% of debt maturity by 31 March 2023.
By the way, the manager has disclosed the "Distribution to Unitholders" figure for this quarter, it would be perfect if the manager could disclose the breakdown (Note A like other REITs) of the "adjustment for net effect of non-tax chargeable items and other adjustments" in the distribution statement for upcoming financial statements.
You could also refer below for more information:
SREITs Dashboard - Detailed information on individual Singapore REIT
SREITs Data - Overview and detail of Singapore REIT
REIT Review - List of previous REIT review posts
Singapore REITs Post Telegram Channel - Join to receive posts for Singapore REITs
REIT-TIREMENT Patreon - Support my work and get exclusive content
REIT-TIREMENT Facebook Page - Support by liking my Facebook Page
REIT Investing Community - Facebook Group where members share and discuss REIT topic
*Disclaimer: The information presented on this blog is for educational and informational purposes only. The materials, including research and opinions, are based solely on my own findings and should not be considered as professional financial advice or a definitive statement of fact. I cannot guarantee the accuracy, completeness, or reliability of the information provided. I shall not be held liable for any errors, omissions, or losses that may occur as a result of using the information presented on this blog. It should be noted that the information presented on this blog does not constitute a buy, sell, or hold recommendation for any security. It is crucial to conduct your own thorough research and due diligence before making any investment decisions.

No comments:
Post a Comment