


- Main Sector(s): Logistics, Industrial & Office
- Country(s) with Assets: Singapore & Australia
- No. of Properties (exclude development/associate/fund): 29
Key Indicators


- Distributable Income Breakdown:
- 83.8% from Operation
- 16.2 from Fees Paid/Payable in Units (Assume 100% management fees payable in units for the latest quarter, explanation in Author's Opinion section below)
- Distribution = 99.9% of Distributable Income
- Distribution to Perpetual Securities Holder = 29.6% of Distributable Income
Related Parties Shareholding

- REIT sponsor's shareholding: Below median for more than 20%
- REIT manager's shareholding: Above median for more than 20%
- Directors of REIT manager's shareholding: Above median for more than 20%
Lease Profile

- Occupancy: ± 5% from median
- WALE: Above median for more than 10%
- Highest lease expiry within 5 years: Below median for more than 10%; Falls in FY24
- Weighted average land lease expiry: Below median for more than 20%
Debt Profile
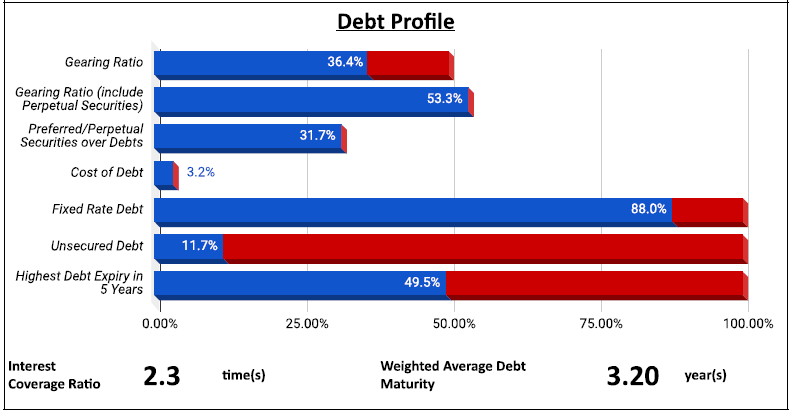
- Gearing ratio: ± 10% from median
- Gearing ratio including perps: Above median for more than 20%
- Cost of debt: Above median for more than 10%
- Fixed rate debt %: Above median for more than 10%
- Unsecured debt %: Below median for more than 20%
- WADM: Above median for more than 10%
- Highest debt maturity within 5 years: Above median for more than 20%; Falls in FY27
- Interest coverage ratio: Below median for more than 20%
Diversification Profile

- Top geographical contribution: Above median for more than 20%
- Top property contribution: Below median for more than 20%
- Top 5 properties' contribution: Below median for more than 10%
- Top tenant contribution: Above median for more than 20%
- Top 10 tenants' contribution: Above median for more than 20%
Key Financial Metrics

- Property yield: Above median for more than 10%
- Management fees over distribution: Above median for more than 20%; $4.33 distribution for every dollar paid
- Distribution on capital: Below median for more than 10%
- Distribution margin: Below median for more than 10%
Trends


- Uptrend: Occupancy
- Flat: NAV per Unit
- Slight Downtrend: DPU
- Downtrend: Interest Coverage Ratio, Property Yield, Distribution on Capital, Distribution Margin
Relative Valuation

- P/NAV: Average for 1y, 3y & 5y
- Dividend Yield: Average for 1y, 3y & 5y
Author's Opinion
| Favorable | Less Favorable |
|---|---|
| Diversified Sector | Low REIT Sponsor's Shareholding |
| High REIT Manager's Shareholding | Short Weighted Average Land Lease Expiry |
| High Directors of REIT Manager's Shareholding | High Perpetual Securities % |
| High Occupancy | High Cost of Debt |
| Long WALE | Low Unsecured Debt % |
| Well Spread Lease Expiry | Concentrated Debt Maturity |
| High Fixed Rate Debt % | Low Interest Coverage Ratio |
| Long WADM | High Top Geographical Contribution |
| Low Top Property & Top 5 Properties Contributions | High Top Tenant & Top 10 Tenants Contributions |
| High Property Yield | Non Competitive Management Fees |
| Occupancy Uptrend | Low Distribution on Capital |
| Low Distribution Margin | |
| Interest Coverage Ratio Downtrend | |
| Property Yield Downtrend | |
| Distribution on Capital Downtrend | |
| Distribution Margin Downtrend |
DPU has increased by 7% as compared to 2.42 cents in the previous quarter despite a similar gross revenue and NPI. While the DPU increase is good news, I am curious to know where the increase comes from. As shared in my previous post - REIT Distribution Demystified and Manipulatable Components, there are manipulatable components that a REIT could manage their DPU. From the business updates, there is no income support or proceeds from divestment mentioned. And with similar gross revenue/NPI, the distributable income from directly managed assets would be more or less the same. As for distribution from JV, the figure is consistent for the past 1 year financial statement. As such, I think the key lies in management fees payable in units. Let's see below for the extracts from 1H FY23 financial statement.


Now, I would take 50% of the above figures as a quarter average and compare them with 3Q FY23.

You could also refer below for more information:
SREITs Dashboard - Detailed information on individual Singapore REIT
SREITs Data - Overview and detail of Singapore REIT
REIT Review - List of previous REIT review posts
Singapore REITs Post Telegram Channel - Join to receive posts for Singapore REITs
REIT-TIREMENT Patreon - Support my work and get exclusive content
REIT-TIREMENT Facebook Page - Support by liking my Facebook Page
REIT Investing Community - Facebook Group where members share and discuss REIT topic
*Disclaimer: The information presented on this blog is for educational and informational purposes only. The materials, including research and opinions, are based solely on my own findings and should not be considered as professional financial advice or a definitive statement of fact. I cannot guarantee the accuracy, completeness, or reliability of the information provided. I shall not be held liable for any errors, omissions, or losses that may occur as a result of using the information presented on this blog. It should be noted that the information presented on this blog does not constitute a buy, sell, or hold recommendation for any security. It is crucial to conduct your own thorough research and due diligence before making any investment decisions.

No comments:
Post a Comment