
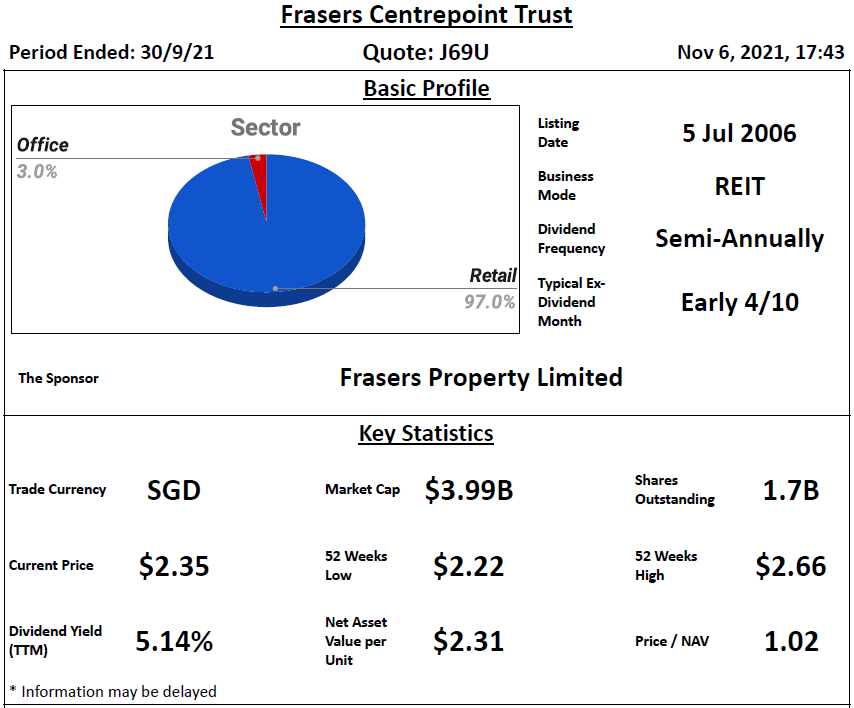
Basic Profile & Key Statistics

Performance Highlight


Related Parties Shareholding

- REIT sponsor's shareholding is high at 41.026%
- REIT manager's shareholding is high at 4.316%
- Directors of REIT manager's shareholding is low at 0.074%
Lease Profile

- Occupancy is slightly high at 97.3%
- WALE is short at 1.64 years
- Highest lease expiry within 5 years is high at 35.6% which falls in FY2022
- Weighted average land lease expiry is slight long at 72.05 years
Debt Profile

- Gearing ratio is low at 33.3%
- Cost of debt is slightly low at 2.2%
- Fixed rate debt % is low at 56%
- Unsecured debt % is low at 47.4%
- WADM is short at 2.47 years
- Highest debt maturity within 5 years is low at 28.2% which falls in FY2024
- Interest coverage ratio is high at 5.1 times
Diversification Profile

- Top geographical contribution is high at 99.8%
- Top property contribution is high at 22.7%
- Top 5 properties contribution is high at 77.4%
- Top tenant contribution is low at 3.6%
- Top 10 tenants contribution is low at 19.7%
Key Financial Metrics

- Property yield is slightly low at 4.6%
- Management fees over distribution is high at 15.8% in which unitholders receive S$ 6.33 for every dollar paid
- Distribution on capital is slightly low at 3.5%
- Distribution margin is high at 56.2%
Trends


- Uptrend - NAV per Unit
- Downtrend - DPU, Interest Coverage Ratio, Property Yield, Distribution on Capital, Distribution Margin
Relative Valuation

- P/NAV - Below average for 1y, 3y and 5y
- Dividend Yield - Above +1SD for 1y; Above average for 3y; Average for 5y
Author's Opinion
| Favorable | Less Favorable |
|---|---|
| High REIT Sponsor's Shareholding | Low Directors of REIT Manager's Shareholding |
| High REIT Manager's Shareholding | Short WALE |
| Low Gearing Ratio | Concentrated Lease Expiry |
| Well Spread Debt Maturity | Low Fixed Rate % |
| High Interest Coverage Ratio | Low Unsecured Debt % |
| Low Top Tenant & Top 10 Tenants Contributions | Short WADM |
| High Distribution Margin | High Top Geographical Contribution |
| NAV per Unit Uptrend | High Top Property & Top 5 Properties Contributions |
| Non-Competitive Management Fees | |
| DPU Downtrend | |
| Interest Coverage Ratio Downtrend | |
| Property Yield Downtrend | |
| Distribution on Capital Downtrend | |
| Distribution Margin Downtrend |
FCT FY DPU managed to hit 12.085 cents, which is slightly higher than the pre-covid level of 12.07 cents at FY20 and 12.015 cents at FY19. Moving forward, the gradual recovery of economic activities and the possible easing of restriction should help to improve FCT performance further.
Join REIT-TIREMENT Patreon for patron-exclusive posts that cover REITs valuation and more detail on fundamental analysis. You could also refer below for more information:
SREITs Dashboard - Detailed information on individual Singapore REIT
SREITs Data - Overview and Detail of Singapore REIT
REIT Analysis - List of previous REIT analysis posts
REIT-TIREMENT Telegram Channel - Join to receive updates on new post
REIT-TIREMENT Facebook Page - Support by liking my Facebook Page
REIT Investing Community - Facebook Group where members share and discuss REIT topic
*Disclaimer: Materials in this blog are based on my research and opinion which I don't guarantee accuracy, completeness, and reliability. It should not be taken as financial advice or a statement of fact. I shall not be held liable for errors, omissions and loss or damage as a result of the use of the material in this blog. Under no circumstances does the information presented on this blog represent a buy, sell, or hold recommendation on any security, please always do your own due diligence before any decision is made.

No comments:
Post a Comment