
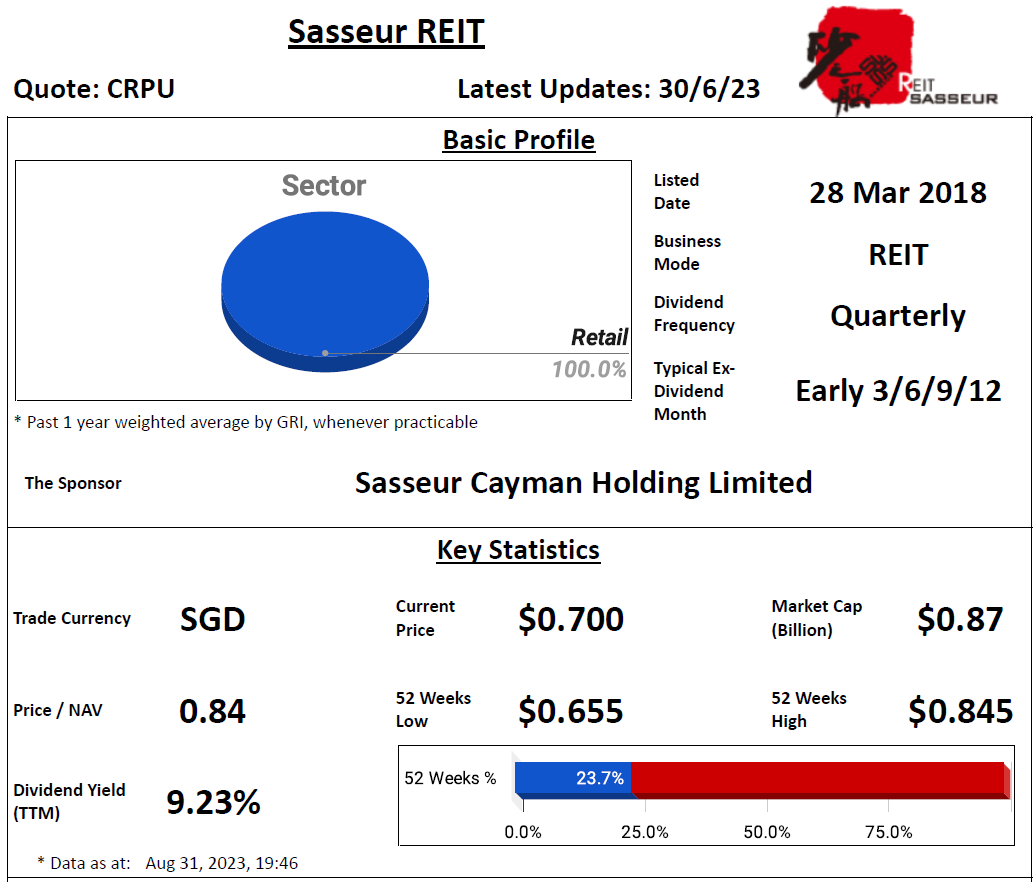

- Main Sector(s): Retail
- Country(s) with Assets: China
- No. of Properties (exclude associate/fund): 4
Key Indicators


Sales

Asset Enhancement Initiative

Related Parties Shareholding

- REIT Sponsor's Shareholding: Above median by 20% or more
- REIT Manager's Shareholding: Above median by 20% or more
- Directors of REIT Manager's Shareholding: Above median by 20% or more
Lease Profile

- Committed Occupancy: ± 5% from median
- Income in SGD/Major Currencies: All income is received in RMB
- WALE: Below median by 20% or more
- Highest Lease Expiry within 5 Years: Above median by 20% or more; Falls in this year
- Weighted Average Land Lease Expiry: Below median by 20% or more
Debt Profile

- Gearing Ratio: Below median by 20% or more
- Cost of Debt: Above median by 20% or more
- Fixed Rate Debt %: ± 10% from median
- Unsecured Debt %: 0%
- WADM: Above median by 20% or more
- Highest Debt Maturity within 5 Years: Above median by 20% or more; Falls in 2026
- Interest Coverage Ratio: Above median by 10% or more
Diversification Profile

- Top Geographical Contribution: ± 10% from median
- Top Property Contribution: Above median by 20% or more
- Top 5 Properties' Contribution: Above median by 20% or more
- Top Tenant Contribution: Below median by 20% or more
- Top 10 Tenants' Contribution: Below median by 20% or more
Key Financial Metrics

- Property Yield: Above median by 20% or more
- Management Fees over Distributable Operating Income: Below median by 20% or more; $9.01 distribution for every dollar paid
- Distributable Operating Income on Capital: Above median by 20% or more
- Distributable Operating Income Margin: Above median by 20% or more
- Operating Distribution Proportion: ± 5% from median

- TTM DPU Breakdown:
- 89% from Operation
- 11% from Fees Payable/Paid in Units
- TTM DPU = 91.1% of Distributable Income
Trends


- Uptrend: Interest Coverage Ratio, Operating Distributable Income on Capital, Operating Distributable Income Margin
- Slight Uptrend: NAV per Unit
- Flat: DPU from Operation, Committed Occupancy
- Downtrend: Property Yield
Relative Valuation


- Dividend Yield: Average for 1y & 5y; Above +1SD for 3y
- P/NAV: Average for 1y, 3y & 5y
Author's Opinion
| Favorable | Less Favorable |
|---|---|
| High REIT Sponsor's Shareholding | All income is received in RMB |
| High REIT Manager's Shareholding | Short WALE |
| High Directors of REIT Manager's Shareholding | Concentrated Lease Expiry |
| Low Gearing Ratio | Short Weighted Average Land Lease Expiry |
| Long WADM | High Cost of Debt |
| High Interest Coverage Ratio | 0% Unsecured Debt |
| Low Top Tenant & Top 10 Tenants' Contributions | Concentrated Debt Maturity |
| High Property Yield | High Top Property & Top 5 Properties' Contributions |
| Competitive Management Fees | Property Yield Downtrend |
| High Distributable Operating Income on Capital | |
| High Distributable Operating Income Margin | |
| Interest Coverage Ratio Uptrend | |
| Operating Distributable Income on Capital Uptrend | |
| Operating Distributable Income Margin Uptrend |
EMA's rental income decreased in the current quarter compared to the previous one, primarily due to reduced variable components influenced by the seasonal retail patterns (1Q 2023 sales boosted by larger-scale sales events such as Chinese New Year’s promotions). As a result, distributable income has declined. In terms of debt, there's no refinancing requirement for the current year, while 12.9% of the debt is set to mature in the next year. With a moderate proportion of fixed-rate debt and a slight reduction in the 5-year Loan Prime Rate, finance costs for Sasseur REIT should remain stable.
For more information, check out:
SREITs Dashboard - Detailed information on individual Singapore REIT
SREITs Data - Overview and details of Singapore REIT
REIT Review - List of previous REIT review posts
Singapore REITs Post Telegram Channel - Join to receive posts for Singapore REITs
REIT-TIREMENT Patreon - Support my work and get exclusive content
REIT-TIREMENT Facebook Page - Support by liking my Facebook Page
REIT Investing Community - Facebook Group where members share and discuss REIT topic
*Disclaimer: The information presented on this blog is for educational and informational purposes only. The materials, including research and opinions, are based solely on my findings and should not be considered professional financial advice or a definitive statement of fact. I cannot guarantee the accuracy, completeness, or reliability of the information provided. I shall not be held liable for any errors, omissions, or losses that may occur as a result of using the information presented on this blog. It should be noted that the information presented on this blog does not constitute a buy, sell, or hold recommendation for any security. It is crucial to conduct your own thorough research and due diligence before making any investment decisions.

No comments:
Post a Comment