
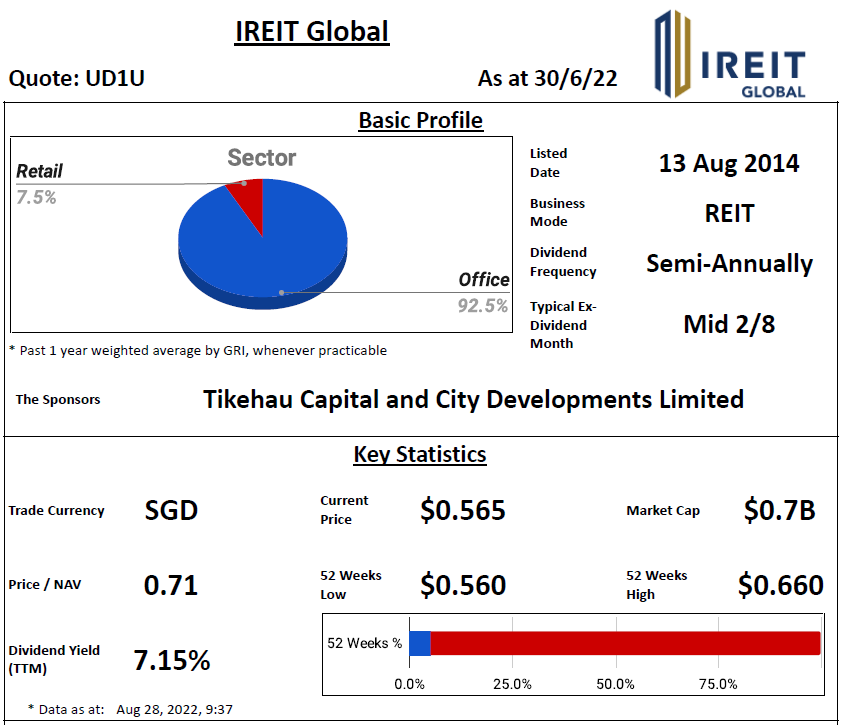
Basic Profile & Key Statistics

- Main Sector(s): Office & Retail
- Country(s) with Assets: Germany, Spain & France
- No. of Properties (exclude development/associate/fund): 37
Key Indicators

Performance Highlight

Related Parties Shareholding

- REIT sponsor's shareholding: Above median for more than 20%
- REIT manager's shareholding: Below median for more than 20%
- Directors of REIT manager's shareholding: ± 10% from median
Lease Profile

- Occupancy: ± 5% from median
- WALE: Above median for more than 10%
- Highest lease expiry within 5 years: Above median for more than 10%; Falls in 2024
- Weighted average land lease expiry: 100% freehold properties
Debt Profile

- Gearing ratio: Below median for more than 10%
- Cost of debt: Below median for more than 20%
- Fixed rate debt %: 100%
- Unsecured debt %: 0%
- WADM: Above median for more than 20%
- Highest debt maturity within 5 years: Above median for more than 20%; Falls in 2026
- Interest coverage ratio: Above median for more than 20%
Diversification Profile

- Top geographical contribution: Below median for more than 20%
- Top property contribution: Above median for more than 20%
- Top 5 properties' contribution: Above median for more than 20%
- Top tenant contribution: Above median for more than 20%
- Top 10 tenants' contribution: Above median for more than 20%
Key Financial Metrics

- Property yield: ± 10% from median
- Management fees over distribution: Below median for more than 10%; $8.77distribution for every dollar paid
- Distribution on capital: ± 10% from median
- Distribution margin: Above median for more than 10%
Trends


- Uptrend: NAV per Unit, Interest Coverage Ratio
- Slight Downtrend: Occupancy
- Downtrend: DPU, Property Yield, Distribution on Capital, Distribution Margin
Relative Valuation

- P/NAV - Below -1SD for 1y, 3y & 5y
- Dividend Yield - Average for 1y, 3y & 5y
Author's Opinion
| Favorable | Less Favorable |
|---|---|
| Diversified Sector | Low REIT Manager's Shareholding |
| High REIT Sponsor's Shareholding | Concentrated Lease Expiry |
| Long WALE | 0% Unsecured Debt |
| 100% Freehold Properties | Concentrated Debt Maturity |
| Low Gearing Ratio | High Top Property & Top 5 Properties Contributions |
| Low Cost of Debt | High Top Tenant & Top 10 Tenants Contributions |
| 100% Fixed Rate Debt | DPU Downtrend |
| Long WADM | Property Yield Downtrend |
| High Interest Coverage Ratio | Distribution on Capital Downtrend |
| Low Top Geographical Contribution | Distribution Margin Downtrend |
| Competitive Management Fees | |
| High Distribution Margin | |
| NAV per Unit Uptrend | |
| Interest Coverage Ratio Uptrend |
Performance has improved as compared to 1H 2021 due to the full half yearly contribution from new properties which were acquired in 3Q 2021. However, from the presentation, manager has mentioned that the key markets have slowed down in 2Q2022 due to economic uncertainty caused by the war in Ukraine, high inflation and rising financing costs.
You could also refer below for more information:
SREITs Dashboard - Detailed information on individual Singapore REIT
SREITs Data - Overview and Detail of Singapore REIT
REIT Analysis - List of previous REIT analysis posts


REIT-TIREMENT Telegram Channel - Join to receive updates on new post
REIT-TIREMENT Patreon - Support my work and get exclusive contents
REIT-TIREMENT Facebook Page - Support by liking my Facebook Page
REIT Investing Community - Facebook Group where members share and discuss REIT topic
*Disclaimer: Materials in this blog are based on my research and opinion which I don't guarantee accuracy, completeness, and reliability. It should not be taken as financial advice or a statement of fact. I shall not be held liable for errors, omissions and loss or damage as a result of the use of the material in this blog. Under no circumstances does the information presented on this blog represent a buy, sell, or hold recommendation on any security, please always do your own due diligence before any decision is made.

Hi. Your figures don't match up due to currency difference. Price, NAV, Price/NAV, DPU, Dividend Yield are off.
ReplyDeleteThanks for informing, I have corrected the dividend yield part. Now, P/NAV, div yield and relative charts are using SGD. However, for the trend, I am using Euro, so no currency conversion issue, have indicated a remark for it.
DeleteThanks. I have always loved reading the stuff you post =)
DeleteThanks, happy to know you like my blog
Delete