

Basic Profile & Key Statistics
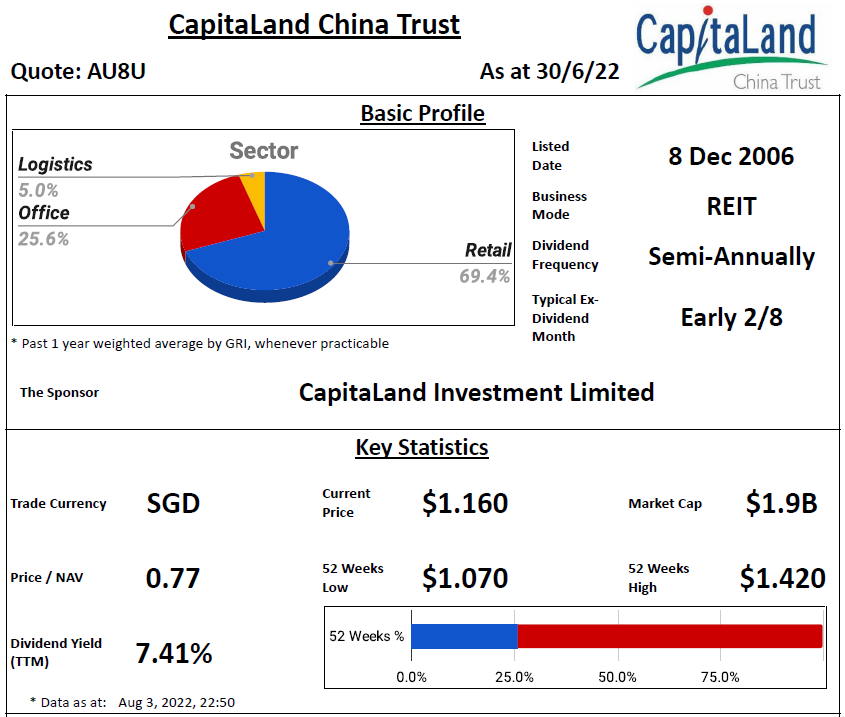
- Main Sector(s): Retail, Office & Logistics
- Country(s) with Assets: China
- No. of Properties (exclude development/associate/fund): 20
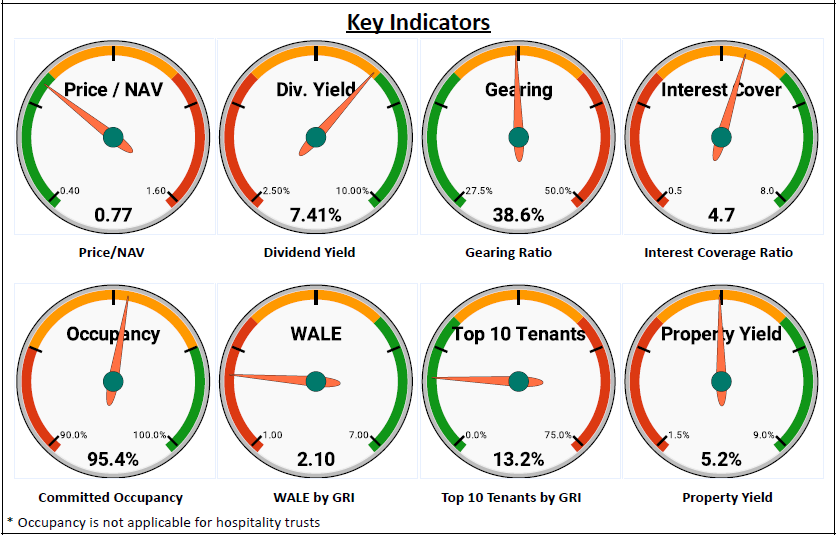
Key Indicators
Performance Highlight


Related Parties Shareholding

- REIT sponsor's shareholding: Above median for more than 20%
- REIT manager's shareholding: Above median for more than 20%
- Directors of REIT manager's shareholding: Below median for more than 20%
Lease Profile

- Occupancy: ± 5% from median
- All income is received in RMB
- WALE: Below median for more than 20%
- Highest lease expiry within 5 years: Above median for more than 20%; Falls in 2023
- Weighted average land lease expiry: Below median for more than 20%
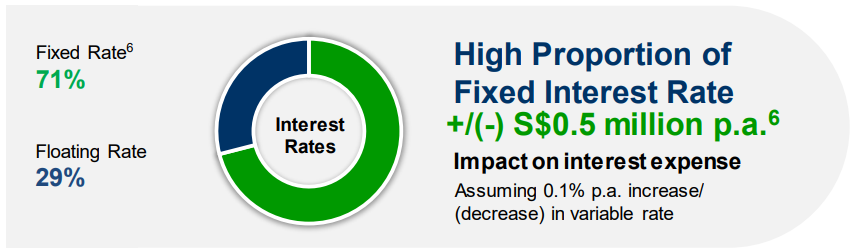
Debt Profile

- Gearing ratio: ± 10% from median
- Gearing ratio including perps: ± 10% from median
- Cost of debt: ± 10% from median
- Fixed rate debt %: ± 10% from median
- Unsecured debt %: ± 10% from median
- WADM: ± 10% from median
- Highest debt maturity within 5 years: Below median for more than 20%; Falls in 2023
- Interest coverage ratio: Above median for more than 10%
Diversification Profile

- Top geographical contribution: Below median for more than 20%
- Top property contribution: Below median for more than 20%
- Top 5 properties' contribution: ± 10% from median
- Top tenant contribution: Below median for more than 20%
- Top 10 tenants' contribution: Below median for more than 20%
Key Financial Metrics

- Property yield: ± 10% from median
- Management fees over distribution: ± 10% from median; $6.29 distribution for every dollar paid
- Distribution on capital: Below median for more than 10%
- Distribution margin: Below median for more than 20%
Trends


- Flat: Occupancy
- Slight Downtrend: NAV per Unit
- Downtrend: DPU, Interest Coverage Ratio, Property Yield, Distribution on Capital, Distribution Margin
Relative Valuation

- P/NAV - Average for 1y; Below average for 3y; Below -1SD for 5y
- Dividend Yield - Average for 1y; Above +1SD for 3y & 5y
Author's Opinion
| Favorable | Less Favorable |
|---|---|
| Diversified Sector | Low Directors of REIT Manager's Shareholding |
| High REIT Sponsor's Shareholding | All income is received in RMB |
| High REIT Manager's Shareholding | Short WALE |
| Well Spread Debt Maturity | Concentrated Lease Expiry |
| High Interest Coverage Ratio | Short Weighted Average Land Lease Expiry |
| Low Top Geographical Contribution | Low Distribution on Capital |
| Low Top Property Contribution | Low Distribution Margin |
| Low Top Tenant & Top 10 Tenants Contributions | DPU Downtrend |
| Interest Coverage Ratio Downtrend | |
| Property Yield Downtrend | |
| Distribution on Capital Downtrend | |
| Distribution Margin Downtrend |
You could also refer below for more information:
SREITs Dashboard - Detailed information on individual Singapore REIT
SREITs Data - Overview and Detail of Singapore REIT
REIT Analysis - List of previous REIT analysis posts


Singapore REITs Post Telegram Channel - Join to receive posts for Singapore REITs
REIT-TIREMENT Patreon - Support my work and get exclusive contents
REIT-TIREMENT Facebook Page - Support by liking my Facebook Page
REIT Investing Community - Facebook Group where members share and discuss REIT topic
*Disclaimer: Materials in this blog are based on my research and opinion which I don't guarantee accuracy, completeness, and reliability. It should not be taken as financial advice or a statement of fact. I shall not be held liable for errors, omissions and loss or damage as a result of the use of the material in this blog. Under no circumstances does the information presented on this blog represent a buy, sell, or hold recommendation on any security, please always do your own due diligence before any decision is made.

No comments:
Post a Comment