
The last update was on 8th October 2021, which was more than 9 months ago, how time flies. This time, there are some slight updates as below:
1) Key Indicators
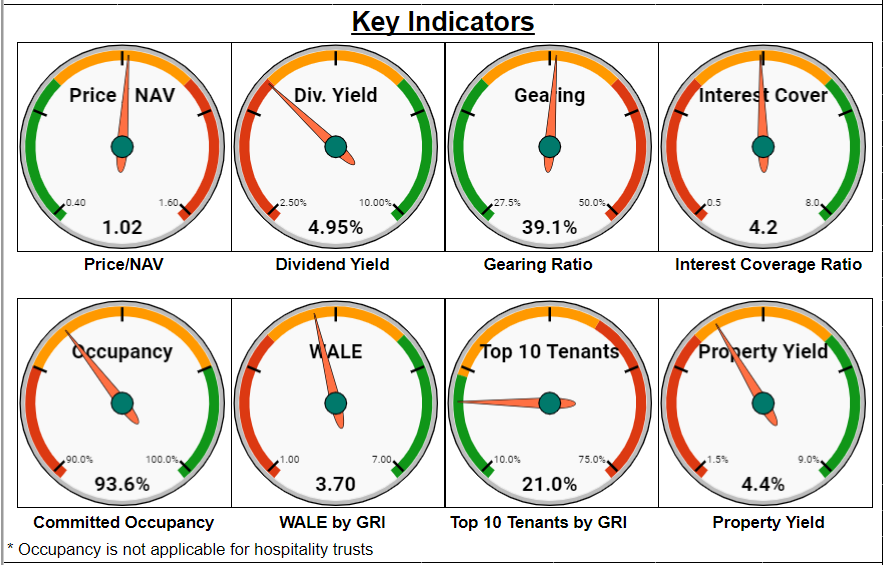
- Added key indicators section immediately after the key statistics.
- Consists of Price/NAV, dividend yield, gearing, interest cover, occupancy, WALE, top 10 tenants and property yield.
- The 3 color ranges (red, orange and green) are set for each indicator. These should be used as references only instead of treated as financial advice.
- For hospitality trusts, occupancy will show as "no data".

2) Header
- Added company logo.

3) Key Statistics
- Added 52 weeks range %, this is a gauge of the current price percentile as compared to the 52 weeks range.
- Removed outstanding shares and NAV per unit to fit the 52 weeks range %.

4) Trends
- Added occupancy trend.
- For hospitality trusts, occupancy will show as "no data".

5) Price Relative Table
- Change the color of the current level to green, so as to differentiate it from other figures.
- In my opinion, this table could save you from the hassle of looking at price relative charts as provided on other platforms. Although those charts are nice to look at, you would have to toggle between different periods and between dividend yield or P/NAV.

6) Useful Links
- Added a new section for relevant links.
- Consists of the links to the official website, SGX announcements, Yahoo Finance, SGinvestors, Investing Note and of course, my review blogposts.

Besides the above updates, I removed REIT-ETF dashboards from my site a few months back, mainly due to tracking difficulties as each has a different reporting date and some information is unavailable.
That is all for this round, if you find SREITs Dashboard useful, please help to share it with your friends.

No comments:
Post a Comment