

Basic Profile & Key Statistics

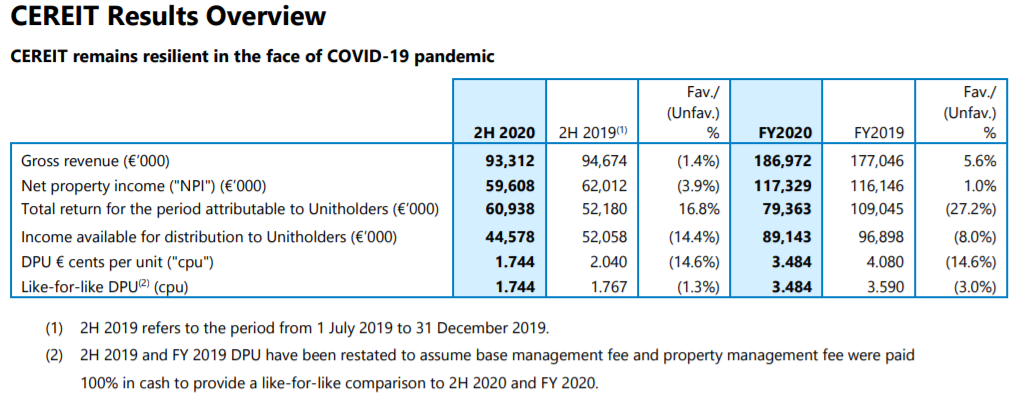
Performance Review


Lease Profile

- Occupancy is slightly high at 95.1%
- WALE is long at 4.9 years
- Highest lease expiry within 5 years is high at 58.6% which falls in 2025 and beyond, without breakdown.
- Weighted average land lease expiry is long at 93.6 years
Debt Profile

- Gearing ratio is moderate at 38.1%
- Cost of debt is low at 1.7%
- Fixed rate debt % is high at 100%
- Unsecured debt % is high at 91%
- WADE is long at 3.8 years
- Highest debt maturity within 5 years is high at 36.2% which falls in 2022
- Interest coverage ratio is high at 6.4 times
Diversification Profile

- Top geographical contribution is low at 9.1% (from 2019 Annual Report)
- Top property contribution is low at 8.4% (from 2019 Annual Report)
- Top tenant contribution is high at 13.2%
- Top 10 tenants contribution is low at 33.8%
- Top 3 countries contributed around 68% of GRI
Key Financial Metrics

- Property yield is slightly high at 5.6%
- Management fees over distribution is competitive at 5.9% in which unitholders receive €16.95 for every dollar paid
- Distribution on capital is high at 4.1%
- Distribution margin is slightly low at 46.2%
- 3.2% of the past 4 quarters' distribution is from asset disposal.
Trends


- Slight Uptrend - Interest Coverage Ratio
- Downtrend - DPU, NAV per Unit, Property Yield, Distribution on Capital, Distribution Margin
Relative Valuation

- Dividend Yield - Past 4 quarters DPU @ 3.484 cents / average yield @ 8.14% = € 0.43
- Price/NAV - NAV @ €$ 0.509 x average P/NAV @ 0.95 = € 0.485
Author's Opinion
| Favorable | Less Favorable |
|---|---|
| Diversified Sector | Concentrated Debt Maturity |
| Long WALE | High Top Tenant Contribution |
| Long Weighted Average Land Lease Expiry | DPU Downtrend |
| Low Cost of Debt | NAV per Unit Downtrend |
| High Unsecured Debt | Property Yield Downtrend |
| Long WADE | Distribution on Capital Downtrend |
| High Interest Coverage Ratio | Distribution Margin Downtrend |
| Low Top Geographical Contribution | |
| Low Top Property Contribution | |
| Low Top 10 Tenants Contribution | |
| Competitive Management Fee | |
| High Distribution on Capital |
The main reason for DPU decrease is due to both base management fees and property management fees had been paid 100% in cash for FY 2020. Overall, CEREIT fundamentals remain healthy at this moment. As for the private placement, it is at 0.21% DPU accretive (pro forma) based on the issued price of € 0.44. And since the final issued price is fixed lower at € 0.43, the DPU accretion (or dilution) would be insignificant.
For more information, you could refer to:
SREITs Dashboard - Detailed information on individual Singapore REIT
SREITs Data - Overview of Singapore REIT
REIT Analysis - List of previous REIT analysis posts
REIT-TIREMENT Patreon - Support this blog as a Patron and get SREITs Dashboard PDF
REIT Investing Community - Facebook Group where members share and discuss REIT topic
*Disclaimer: Materials in this blog are based on my research and opinion which I don't guarantee accuracy, completeness, and reliability. It should not be taken as financial advice or a statement of fact. I shall not be held liable for errors, omissions as well as loss or damage as a result of the use of the material in this blog. Under no circumstances does the information presented on this blog represent a buy, sell, or hold recommendation on any security, please always do your own due diligence before any decision is made.

No comments:
Post a Comment