
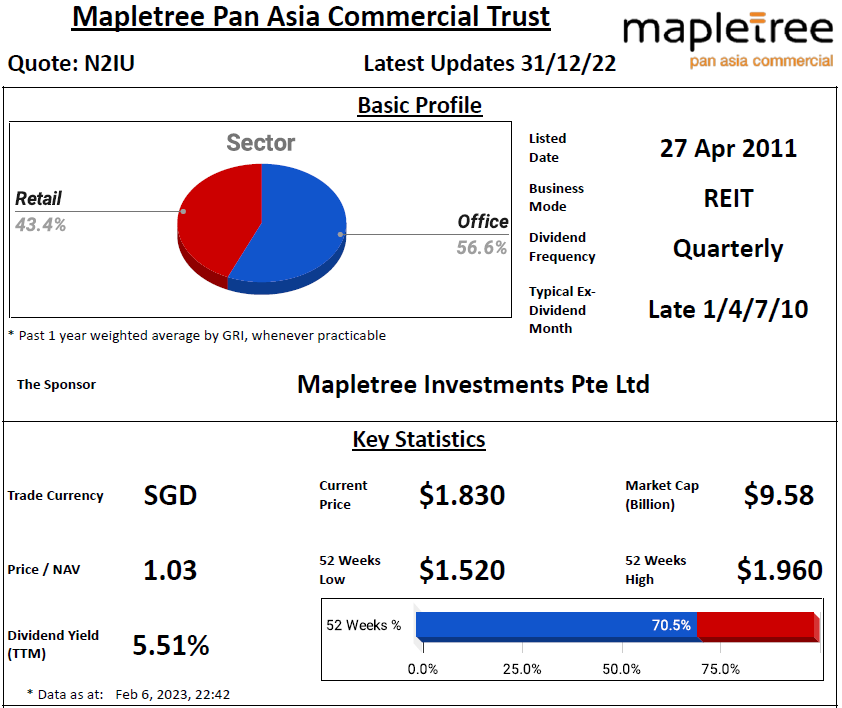

- Main Sector(s): Office & Retail
- Country(s) with Assets: Singapore, China, Hong Kong, Japan & South Korea
- No. of Properties (exclude development/associate/fund): 18
Key Indicators


Shopper Traffic & Tenant Sales


Sensitivity to Interest Rate


- Distributable Income Breakdown:
- 91.8% from Operation
- 3.8% from Release of Retention/Capital
- 4.4% from Fees Payable/Paid in Units
- Distribution = 100% of Distributable Income
- Distribution to Perpetual Securities Holder = 0.6% of Distributable Income
Related Parties Shareholding
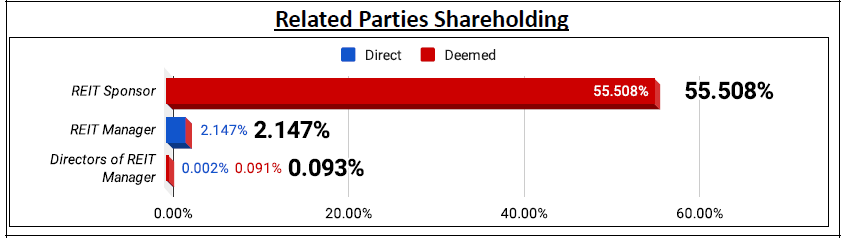
- REIT Sponsor's Shareholding: Above median for more than 20%
- REIT Manager's Shareholding: Above median for more than 20%
- Directors of REIT Manager's Shareholding: Below median for more than 10%
Lease Profile
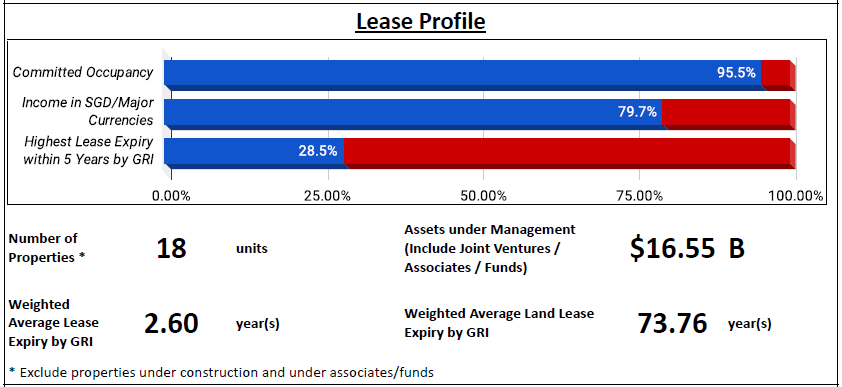
- Occupancy: ± 5% from median
- WALE: Below median for more than 20%
- Highest Lease Expiry within 5 Years: Above median for more than 10%; Falls in FY26/27, without breakdown.
- Weighted Average Land Lease Expiry: ± 10% from median
Debt Profile

- Gearing Ratio: ± 10% from median
- Gearing including Perps: ± 10% from median
- Cost of Debt: Below median for more than 10%
- Fixed Rate Debt %: ± 10% from median
- Unsecured Debt %: ± 10% from median
- WADM: ± 10% from median
- Highest Debt Maturity within 5 Years: Below median for more than 20%; Falls in FY24/25
- Interest Coverage Ratio: ± 10% from median
Diversification Profile

- Top Geographical Contribution: Above median for more than 20%
- Top Property Contribution: Above median for more than 20%
- Top 5 Properties' Contribution: Above median for more than 20%
- Top Tenant Contribution: Below median for more than 20%
- Top 10 Tenants' Contribution: Below median for more than 20%
Key Financial Metrics
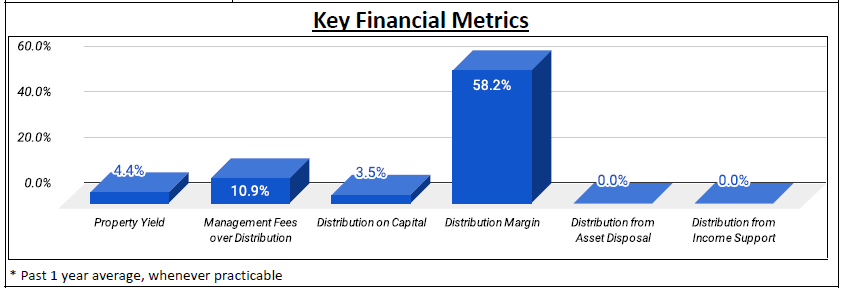
- Property Yield: Below median for more than 10%
- Management Fees over Distribution: Below median for more than 20%; $9.17 distribution for every dollar paid
- Distribution on Capital: ± 10% from median
- Distribution Margin: Above median for more than 20%
Trends
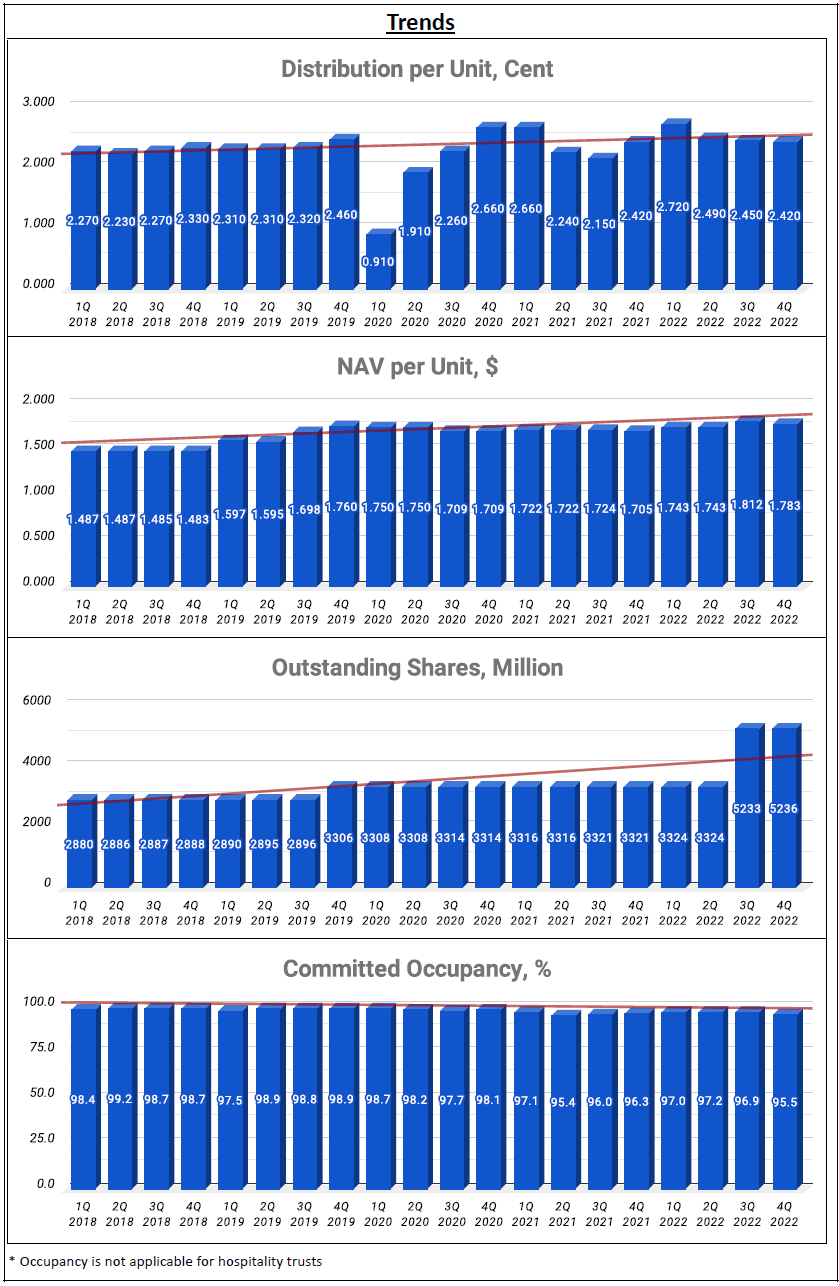
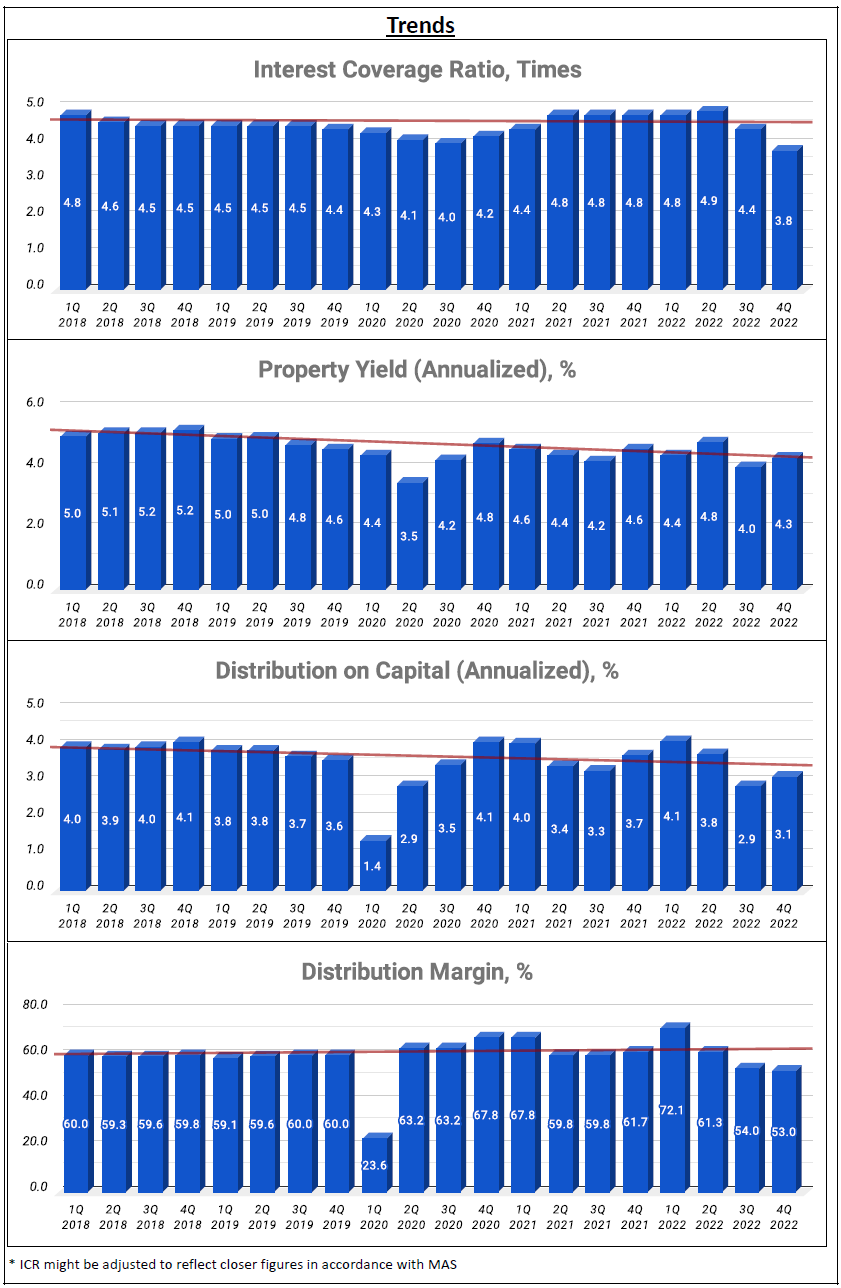
- Uptrend: DPU, NAV per Unit
- Flat: Interest Coverage Ratio, Distribution Margin
- Slight Downtrend: Occupancy
- Downtrend: Property Yield, Distribution on Capital
Relative Valuation

- P/NAV: Average for 1y; Below average for 3y; Below -1SD for 5y
- Dividend Yield: Average for 1y; Above +1SD for 3y; Above average for 5y
Author's Opinion
| Favorable | Less Favorable |
|---|---|
| Diversified Sector | Short WALE |
| High REIT Sponsor's Shareholding | High Top Geographical Contribution |
| High REIT Manager's Shareholding | High Top Property & Top 5 Properties' Contributions |
| Low Cost of Debt | Low Property Yield |
| Well Spread Debt Maturity | Property Yield Downtrend |
| Low Top Tenant & Top 10 Tenants' Contributions | Distribution on Capital Downtrend |
| Competitive Management Fees | |
| High Distribution Margin | |
| DPU Uptrend | |
| NAV per Unit Uptrend |
The occupancy rate has decreased slightly from 96.9% in the previous quarter to 95.5%, primarily due to a decline in occupancy at MBC and properties in China. Although Festival Walk's performance remains sluggish and has high negative rental reversion, the reopening of borders between Hong Kong and China on 8 January is anticipated to improve its performance in the upcoming quarters.
For more information, check out:
SREITs Dashboard - Detailed information on individual Singapore REIT
SREITs Data - Overview and details of Singapore REIT
REIT Review - List of previous REIT review posts
Singapore REITs Post Telegram Channel - Join to receive posts for Singapore REITs
REIT-TIREMENT Patreon - Support my work and get exclusive content
REIT-TIREMENT Facebook Page - Support by liking my Facebook Page
REIT Investing Community - Facebook Group where members share and discuss REIT topic
*Disclaimer: The information presented on this blog is for educational and informational purposes only. The materials, including research and opinions, are based solely on my own findings and should not be considered as professional financial advice or a definitive statement of fact. I cannot guarantee the accuracy, completeness, or reliability of the information provided. I shall not be held liable for any errors, omissions, or losses that may occur as a result of using the information presented on this blog. It should be noted that the information presented on this blog does not constitute a buy, sell, or hold recommendation for any security. It is crucial to conduct your own thorough research and due diligence before making any investment decisions.

No comments:
Post a Comment