


- Main Sector(s): Office
- Country(s) with Assets: England, Scotland & Wales
- No. of Properties (exclude development/associate/fund): 155
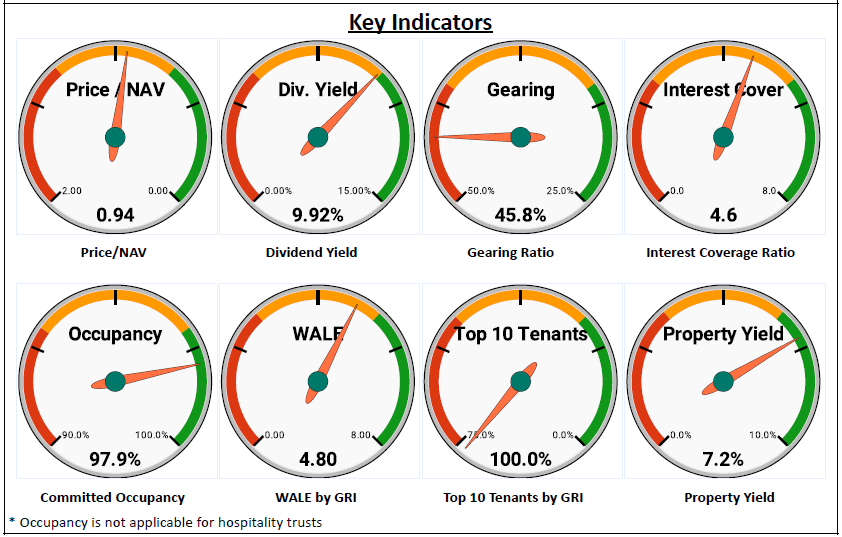
Key Indicators

Rental Reversion

Asset Enhancement Initiative


- Distributable Income Breakdown:
- 99.9% from Operation
- 0.1% from Release of Retention/Capital
- Distribution = 100% of Distributable Income
Related Parties Shareholding

- REIT Sponsor's Shareholding: Below median for more than 20%
- REIT Manager's Shareholding: Below median for more than 20%
- Directors of REIT Manager's Shareholding: Above median for more than 20%
Lease Profile

- Occupancy: ± 5% from median
- WALE: Above median for more than 20%
- Highest Lease Expiry within 5 Years: Below median for more than 20%; Falls in this year
- Weighted Average Land Lease Expiry: Majorities are freehold properties with some longer than 99 years remaining land tenure
Debt Profile

- Gearing Ratio: Above median for more than 20%
- Cost of Debt: Above median for more than 20%
- Fixed Rate Debt %: ± 10% from median
- Unsecured Debt %: 0%
- WADM: Below median for more than 20%
- Highest Debt Maturity within 5 Years: Above median for more than 20%; Falls in 2024
- Interest Coverage Ratio: Above median for more than 20%
Diversification Profile

- Top Geographical Contribution: Below median for more than 20%
- Top Property Contribution: Below median for more than 20%
- Top 5 Properties' Contribution: Below median for more than 20%
- Top Tenant Contribution: Above median for more than 20%
- Top 10 Tenants' Contribution: Above median for more than 20%
Key Financial Metrics

- Property Yield: Above median for more than 20%
- Management Fees over Distribution: Below median for more than 20%; $10 distribution for every dollar paid
- Distribution on Capital: Above median for more than 20%
- Distribution Margin: Above median for more than 20%
Trends


- Flat: DPU, Occupancy, Property Yield
- Slight Downtrend: NAV per Unit
- Downtrend: Interest Coverage Ratio, Distribution on Capital, Distribution Margin
Relative Valuation

- P/NAV: Below -1SD for 1y & 3y
- Dividend Yield: Above +1SD for 1y; Above +2SD for 3y
Author's Opinion
| Favorable | Less Favorable |
|---|---|
| High Directors of REIT Manager's Shareholding | Low REIT Sponsor's Shareholding |
| High Occupancy | Low REIT Manager's Shareholding |
| Long WALE | High Gearing Ratio |
| No Major Lease Expiry within 5 Years | High Cost of Debt |
| Almost 100% Freehold Properties | 0% Unsecured Debt |
| High Interest Coverage Ratio | Short WADM |
| Low Top Geographical Contribution | Concentrated Debt Maturity |
| Low Top Property & Top 5 Properties' Contributions | High Top Tenant & Top 10 Tenants' Contributions |
| High Property Yield | Interest Coverage Ratio Downtrend |
| Competitive Management Fees | Distribution on Capital Downtrend |
| High Distribution on Capital | Distribution Margin Downtrend |
| High Distribution Margin |
Compared to the previous half-yearly results, the distributable income has been affected by a range of factors including lower gross revenue, higher property expenses, increased finance costs, and higher tax expenses. Despite these challenges, there is a positive development to look forward to, as rental rates are expected to increase in April 2023. However, due to some properties would have rental reductions and vacancies, the manager expected that the income will remain stable as stated in the presentation, instead of significant improvement.
For more information, check out:
SREITs Dashboard - Detailed information on individual Singapore REIT
SREITs Data - Overview and details of Singapore REIT
REIT Review - List of previous REIT review posts
Singapore REITs Post Telegram Channel - Join to receive posts for Singapore REITs
REIT-TIREMENT Patreon - Support my work and get exclusive content
REIT-TIREMENT Facebook Page - Support by liking my Facebook Page
REIT Investing Community - Facebook Group where members share and discuss REIT topic
*Disclaimer: The information presented on this blog is for educational and informational purposes only. The materials, including research and opinions, are based solely on my findings and should not be considered professional financial advice or a definitive statement of fact. I cannot guarantee the accuracy, completeness, or reliability of the information provided. I shall not be held liable for any errors, omissions, or losses that may occur as a result of using the information presented on this blog. It should be noted that the information presented on this blog does not constitute a buy, sell, or hold recommendation for any security. It is crucial to conduct your own thorough research and due diligence before making any investment decisions.

No comments:
Post a Comment