

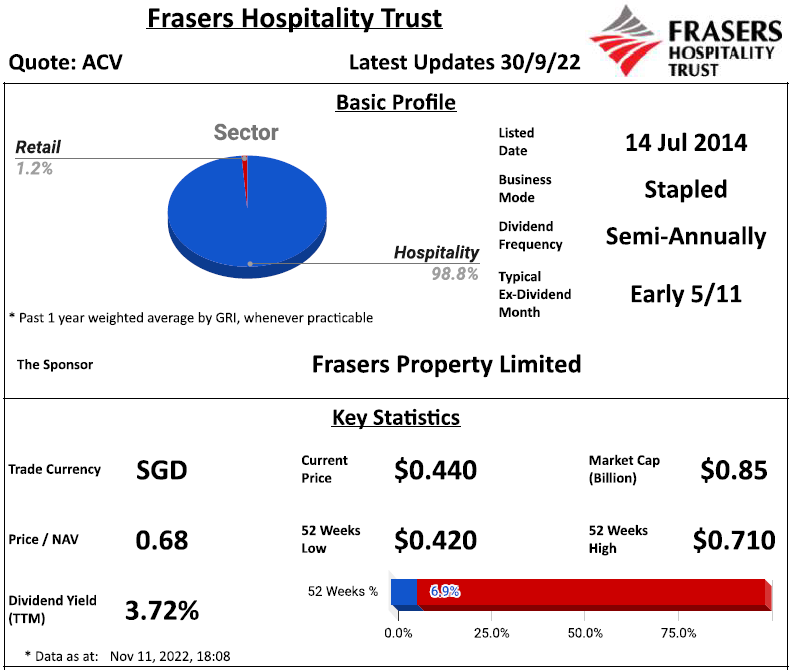
- Main Sector(s): Hospitality
- Country(s) with Assets: Australia, Singapore, England, Japan, Germany, Malaysia & Scotland
- No. of Properties (exclude development/associate/fund): 14

Performance Highlight


REVPAR has improved for all the countries.

- REIT sponsor's shareholding: ± 10% from median
- REIT manager's shareholding: Above median for more than 10%
- Directors of REIT manager's shareholding: Above median for more than 20%
Lease Profile

- WALE: Above median for more than 20%
- Highest lease expiry within 5 years: Below median for more than 20%; Falls in 2024
- Weighted average land lease expiry: Above median for more than 10%
Debt Profile

- Gearing ratio: ± 10% from median
- Cost of debt: Below median for more than 10%
- Fixed rate debt %: Above median for more than 10%
- Unsecured debt %: Above median for more than 10%
- WADM: Below median for more than 20%
- Highest debt maturity within 5 years: Above median for more than 10%; Falls in 2025
- Interest coverage ratio: Below median for more than 20%
Diversification Profile
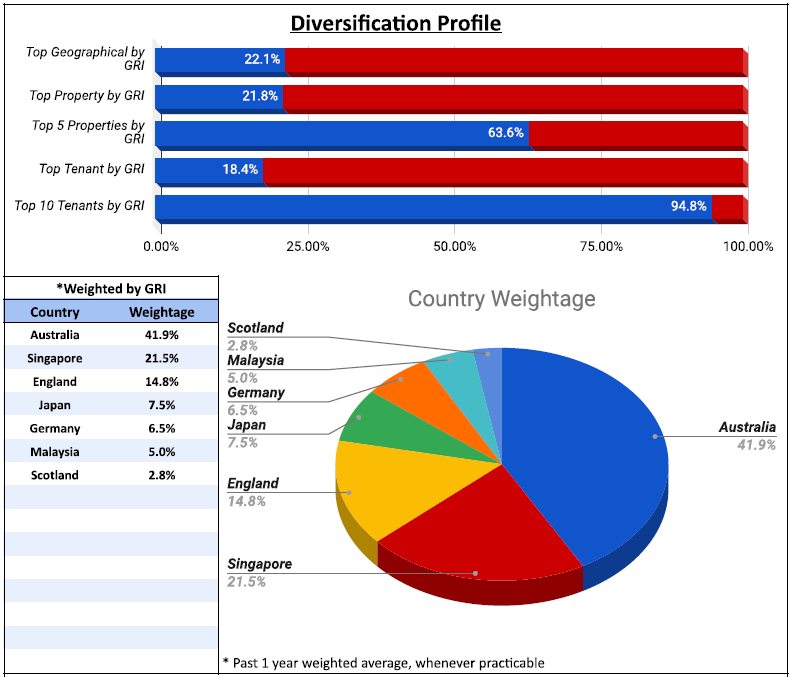
- Top geographical contribution: Below median for more than 20%
- Top property contribution: ± 10% from median
- Top 5 properties' contribution: ± 10% from median
- Top tenant contribution: Above median for more than 20%
- Top 10 tenants' contribution: Above median for more than 20%
Key Financial Metrics
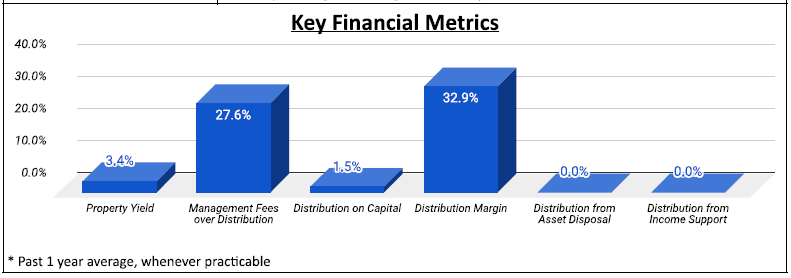
- Property yield: Below median for more than 20%
- Management fees over distribution: Above median for more than 20%; $3.62 distribution for every dollar paid
- Distribution on capital: Below median for more than 20%
- Distribution margin: Below median for more than 20%
Trends


- Downtrend: DPU, NAV per Unit, Property Yield, Interest Coverage Ratio, Distribution on Capital, Distribution Margin
Relative Valuation

- Current 52 Weeks Range: 6.9%
- P/NAV: Below -1SD for 1y & 5y; Below average for 3y
- Dividend Yield: Above +1SD for 1y; Above average for 3y; Average for 5y
Author's Opinion
| Favorable | Less Favorable |
|---|---|
| High Directors of REIT Manager's Shareholding | Short WADM |
| Long WALE | Low Interest Coverage Ratio |
| No Major Lease Expiry within 5 Years | High Top Tenant & Top 10 Tenants Contributions |
| Long Weighted Average Land Lease Expiry | Low Property Yield |
| Low Cost of Debt | Non Competitive Management Fees |
| High Fixed Rate Debt % | Low Distribution on Capital |
| High Unsecured Debt % | Low Distribution Margin |
| Well Spread Debt Maturity | DPU Downtrend |
| Low Top Geographical Contribution | NAV per Unit Downtrend |
| Property Yield Downtrend | |
| Interest Coverage Ratio Downtrend | |
| Distribution on Capital Downtrend | |
| Distribution Margin Downtrend |
2H performance has improved a lot compared to the 1H due to border opening and easing of travel restrictions. The international tourist arrivals have shown signs of recovery albeit the APAC region still lagging due to some areas remaining slow to lift the restriction. Moving forward, FHT performance is expected to recover gradually.

You could also refer below for more information:
SREITs Dashboard - Detailed information on individual Singapore REIT
SREITs Data - Overview and Detail of Singapore REIT
REIT Analysis - List of previous REIT analysis posts


Singapore REITs Post Telegram Channel - Join to receive posts for Singapore REITs
REIT-TIREMENT Patreon - Support my work and get exclusive content
REIT-TIREMENT Facebook Page - Support by liking my Facebook Page
REIT Investing Community - Facebook Group where members share and discuss REIT topic
*Disclaimer: Materials in this blog are based on my research and opinion which I don't guarantee accuracy, completeness, and reliability. It should not be taken as financial advice or a statement of fact. I shall not be held liable for errors, omissions and loss or damage due to the use of the material in this blog. Under no circumstances does the information presented on this blog represent a buy, sell, or hold recommendation on any security, please always do your own due diligence before any decision is made.

No comments:
Post a Comment