

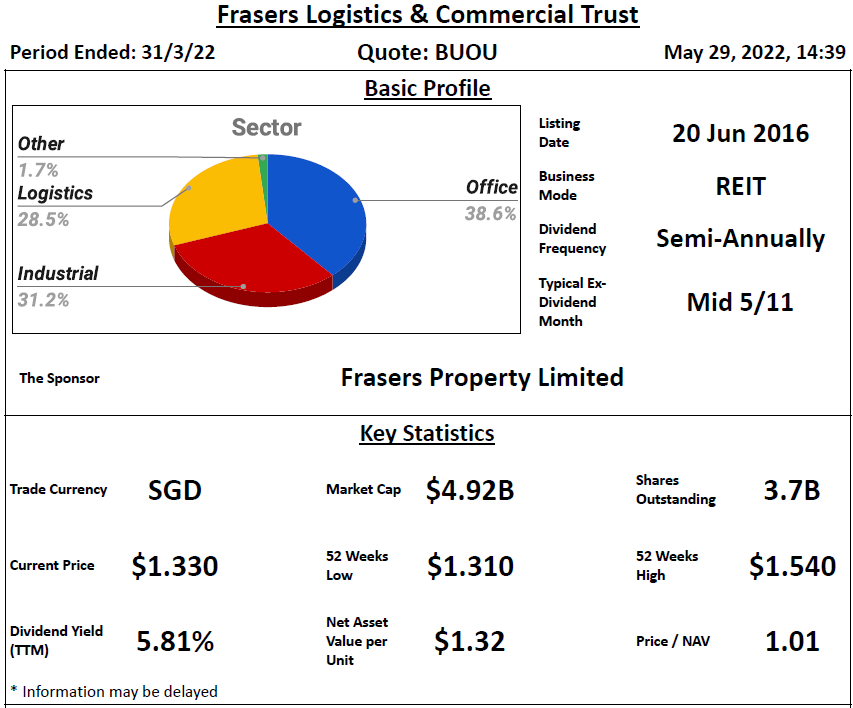
- Main Sector(s): Office, Industrial & Logistics
- Country(s) with Assets: Australia, Singapore, Germany, England & Netherlands
- No. of Properties (exclude development/associate/fund): 101
Performance Highlight


- REIT sponsor's shareholding: Below median for more than 10%
- REIT manager's shareholding: Below median for more than 20%
- Directors of REIT manager's shareholding: Above median for more than 20%
Lease Profile

- Occupancy: ± 5% from median
- WALE: Above median for more than 10%
- Highest lease expiry within 5 years: Below median for more than 20%; Falls in FY25
- Weighted average land lease expiry: Above median for more than 20%
Debt Profile

- Gearing ratio: Below median for more than 10%
- Cost of debt: Below median for more than 10%
- Fixed rate debt %: ± 10% from median
- Unsecured debt %: Above median for more than 10%
- WADM: ± 10% from median
- Highest debt maturity within 5 years: Below median for more than 10%; Falls in FY25
- Interest coverage ratio: Above median for more than 20%
Diversification Profile

- Top geographical contribution: Below median for more than 20%
- Top property contribution: Below median for more than 20%
- Top 5 properties' contribution: Below median for more than 20%
- Top tenant contribution: Below median for more than 20%
- Top 10 tenants' contribution: Below median for more than 20%
Key Financial Metrics

- Property yield: ± 10% from median
- Management fees over distribution: ± 10% from median; $6.62 distribution for every dollar paid
- Distribution on capital: ± 10% from median
- Distribution margin: Above median for more than 20%
Trends


- Uptrend: NAV per Unit, Interest Coverage Ratio,
- Slight Uptrend: DPU
- Flat: Distribution Margin
- Slight Downtrend: Property Yield, Distribution on Capital
Relative Valuation

- P/NAV: Below -1SD for 1y, 3y & 5y
- Dividend Yield: Above +2SD for 1y; Average for 3y & 5y
Author's Opinion
| Favorable | Less Favorable |
|---|---|
| Diversified Sector | Low REIT Sponsor's Shareholding |
| High Directors of REIT Manager's Shareholding | Low REIT Manager's Shareholding |
| Long WALE | |
| Well Spread Lease Expiry | |
| Long Weighted Average Land Lease Expiry | |
| Low Gearing Ratio | |
| Low Cost of Debt | |
| High Unsecured Debt % | |
| Well Spread Debt Maturity | |
| High Interest Coverage Ratio | |
| Low Top Geographical Contribution | |
| Low Top Property & Top 5 Properties Contributions | |
| Low Top Tenant & Top 10 Tenants Contributions | |
| High Distribution Margin | |
| NAV per Unit Uptrend | |
| Interest Coverage Ratio Uptrend |
FLCT performance remains resilient despite some slight decline as compared to the previous half-yearly performance. Following the repayment of debt in April, the gearing ratio has reduced to 29.5%, with fixed-rate borrowing increased to 82.6% and WADM extended to 3.1 years. From the presentation, FLCT’s assets and operations in Europe have largely remained unaffected and management expects the operating environment to be improved in view of the strong tenant activity observed.
You could also refer below for more information:
SREITs Dashboard - Detailed information on individual Singapore REIT
SREITs Data - Overview and Detail of Singapore REIT
REIT Analysis - List of previous REIT analysis posts


Singapore REITs Post Telegram Channel - Join to receive posts for Singapore REITs
REIT-TIREMENT Patreon - Support my work and get exclusive contents
REIT-TIREMENT Facebook Page - Support by liking my Facebook Page
REIT Investing Community - Facebook Group where members share and discuss REIT topic
*Disclaimer: Materials in this blog are based on my research and opinion which I don't guarantee accuracy, completeness, and reliability. It should not be taken as financial advice or a statement of fact. I shall not be held liable for errors, omissions and loss or damage due to the use of the material in this blog. Under no circumstances does the information presented on this blog represent a buy, sell, or hold recommendation on any security, please always do your own due diligence before any decision is made.

No comments:
Post a Comment